
Recommendation
The ability to adequately characterize the lactation curve of livestock is important not only to ensure proper nutrition of the lactating animal but, among many other benefits, it can assist in diagnosing the incidence of diseases, predicting the quantity of milk production, and comparing animals within the herd for managerial strategies such as culling. Eventually, such smart fitting algorithms can lead to improved genetic selection of more productive animals after genetic-unrelated noises are removed from the data, systematically.
The manuscript by Ben Abdelkrim et al. developed and explained an algorithm to detect perturbations in lactation curves of dairy goats. Researchers have been interested in accurately describing lactation curves since the early-1960s. Johansson [1] proposed a nonlinear decay function, Nelder [2] described an inverse polynomial, and Wood [3] proposed the incomplete gamma function to describe milk production of dairy cows. Unfortunately, many of the lactating animals that yielded lactation curves that did not comply with the typical, expected pattern of milk production were usually discarded and, until then, efforts to address this lack of adherence were not conducted. The recommended manuscript provides a different perspective in which rather than discarding the lactation profile, one can model the perturbations of the lactation curve as an attempt to identify possible problems (e.g., mastitis) and minimize their occurrence. Such an algorithm is important to separate females that show resilient attributes from those females that show sustainable attributes, as per existing definitions proposed by Tedeschi et al. [4].
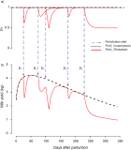
The recommended manuscript proposes the Perturbed Lactation Model to explicitly account for multiple perturbations in the time-series milk production in dairy goats. When perturbations occur in biological processes, a typical negative impact is observed in the animal’s response, but on rare occasions, positive impacts can occur. In this case, the animal responds positively to the perturbation (i.e., responsive), and as a result, there is an increase in their output when compared to unperturbed animals. The recommended manuscript only considered negative impacts due to perturbations in the lactation curve of dairy goats. Future modifications should include positive responses due to perturbations. In this case, animals would be “positively responsive” to perturbations, and examples of such behavior include feed intake and growth curves.
References
[1] Johansson, I. (1961). Genetic Aspects of Dairy Cattle Breeding. University of Illinois Press, Urbana, IL.
[2] Nelder, J. A. (1966). Inverse polynomials, a useful group of multi-factor response functions. Biometrics. 22 (1):128-141. doi: 10.2307/2528220
[3] Wood, P. D. P. (1967). Algebraic model of the lactation curve in cattle. Nature. 216 (5111):164-165. doi: 10.1038/216164a0
[4] Tedeschi, L. O., J. P. Muir, D. G. Riley, and D. G. Fox. (2015). The role of ruminant animals in sustainable livestock intensification programs. Int. J. Sustainable Dev. World Ecol. 22 (5):452-465. doi: 10.1080/13504509.2015.1075441
DOI or URL of the preprint: http://biorxiv.org/cgi/content/short/661249v1
 , posted 16 Jul 2019
Dear authors; three reviewers have expressed positive feedback and important comments and suggestions on various aspects of your study. I concur that the study has merit, but before a final recommendation by the PCI ANSC can be made, I invite you to revise your manuscript based on reviewers' feedback. Please note that a reviewer provided extensive editorial corrections and suggestions to the text, and I believe you should take that into account when revising your manuscript. Please, read carefully the information provided for authors at https://animsci.peercommunityin.org/about/help_generic#For%20authors.
Review of the Manuscript Lactation curve model with explicit representation of perturbations as a phenotyping 1 tool for dairy livestock precision farming.
General comments The manuscript presents a new approach to model the lactation curve using daily records. The approach is highly innovative and offers excellent application opportunities, both for scientific purposes and for managerial strategies at farm level. The model was developed on goat milk records but s highly transferable to other species raised in farms with technological equipment’s allowing to get daily milk records at individual level. The manuscript is clearly written, easily understandable and readable. The mathematical annotation is well integrated within the paragraphs.
The work is very inspiring and valuable. Following the manuscript structure, only minor comments and suggestions, and editorial changes, were reported below:
Abstract Exhaustive and concise. Line 28: it is not clear the use of the word “confronted”. Line 31: this effects is perhaps too far from the related noon. A possible modification of the sentence could be: “[..] can be used to evaluate perturbations…”. Line 44: please check for repetitions.
Introduction The introduction is well structured and brings enough arguments to motivate the work and guide the reader to the relevance of developing a perturbed lactation model. Line 58: Please check the properness of the term “problems” in respect to milk yield. Line 59: cow comfort, welfare and social interaction, as well meteorological changes (not only heat) and feed quality are often related with short term perturbations of lactation curve. Lines from 85 to 93: these aspects are very interesting for model applications and represent a very good frontier in milk yield prediction. I guess that the presented model could contribute to reach these objective in the future. However the use of milk data and events “as proxy” and “alerts” is not covered by the presented analysis, which is mainly based on data fitting. Thus these arguments should be moved in discussions as possible further extensions of the work, etc. Objective: exhaustive clear and concise.
Material and methods Clear and easily readable, both from a conceptual and a mathematical point of view. Methods are reported with enough detail to ensure high level of model replicability. In addition the code is available for academic use. Line 123: Could be useful to include at least a reference for cattle? Any error was detected in presented equations and math annotation. Many acronyms are reported in the manuscript referring to PLM. A table of acronyms might perhaps help the identification of their meaning without needing to go back and read acronyms in methods. Missing spaces were observed at lines: 198, 208, 209, 218, 254, 270, 281, 287.
Results Results were well structured and clearly presented. Enough information was reported to consider the performed statistical analyses and the high potential of the proposed approach in analyzing animal response to environmental stimulus and challenges. Line 300: please check t3→358 days, whereas in methods max lactation length is declared to be 350 days. Line 312 please check (0.17 …), the sentence indicate a decline, thus could it be -0.17? Lines 351 to 356: please check if might be important to highlight that atypical curves observed in the dataset could be biologically true (same animal, extended, etc). Line 347, 348 and 366: A little concern is about the model names. It has to be stated that the paper does not result confusing. Anyway, PLMn seems refer to both unperturbed and perturbed curves. In addition, at line 366 we can read “unperturbed PLM-based model”. It is correct but its explicit name remains “unperturbed perturbed lactation model-based lactation curves”. The use of PLMu could be useful to refer to PLM unperturbed curves even if still contrasting for perturbed-unperturbed. It is understandable that is difficult to find a simple coding for these variables, but being the essential model names it probably deserves a further check.
Lines 406 to 410. Description of parity and age effects is not related with short term perturbations, whereas they are among standard factors affecting lactation curves. Please consider if these sentences are consistent with contents reported from 398 to 403 and 417 to 426.
Missing spaces in lines 316, 386 (missing comma after primiparous), 393, 399, 403 (extraspace), 419.
Table 2. Please consider if decimals have to be reduced according to xxx xx.x x.xx 0.xxx
Discussion Discussion covers many aspects related to milk curve analyses and fitting and possible applicative areas of the presented model. Exhaustive discussions related with fitting and phenotyping were reported. For instance phenotyping will be a promising domain for the use and diffusion of the model. Line 442: please consider that the expression of genetic potential of an animal is not the estimated unperturbed curve. The unperturbed curve is also subjected to farm and other environmental conditions in respect to the cow phenotypic potential. Especially if effects with lo0ng term consequences influence the farm management. Could the sentence include a specification such as: “…[..genetics] in the studied farm under given environmental constraints” or similar concepts? From line 446 to 489 the discussion presents a nice synthesis, but focuses on aspects and findings which are more close to introduction and background. Please consider if it can be moved to introduction. Excluding this part from discussions might help to keep focus on the model purposes, use and applications, which are interestingly reported, in the second part of discussions. The discussion does not present model limits. From a general point of view, few more explicit examples on possible use and characterization of animal events from precision farming data gathering (such as: feed, rumination, health and reproduction variables or indicators) could help to open a window of model use and development to support managerial practices at farm level (please see comments in introduction for alerts and milk yield early estimates).
Conclusions Conclusions can be considered adequate.
It is an elegant model in which the power and flexibility of Gamma density functions (and family) highlights their robustness and inferential capabilities of this family of distributions. The model presented an extraordinary adherence to the observed data and the exampli gratia showed as Figure 2 speaks for itself. I dare to say to authors and readers a word of caution about the way Akaike Information Criterion was used. The use of the smallest AIC does not answer the question: how much this model is superior in terms of its content to explain reality? I would like to see the solutions, their respective sums of squares of the residuals, their corrected AIC (it is rather appropriate to sampled data) and their respective model probabilities and evidence ratios. Other equally likely solutions should not be discarded, but averaged with other model solutions together with the smalles AIC solutions if model uncertainty choice is large enough. Another aspect is the treacherous nonlinear algorithm because of possible numerical artifact parameters. Future users of this model have to keep in mind this possibility. I would like to see future developments particularly by solving this model with generalized nonlinear mixed effects tools that otherwise replace the two step analysis of parameter estimates.
The manuscript entitled “Lactation curve model with explicit representation of perturbations as a phenotyping tool for livestock precision farming” by Ahmed et al. which describes a model to assess perturbations effects on the lactation curve in dairy goats. This manuscript provides a logical reason for the development of a model to assess the lactation curve especially during times of perturbations allowing to determine the effects these events have on the lactation curve. Additionally, there appears to be a lack of information on effects of stress on dairy goat lactations, and therefore, this manuscript provides a tool that can help to assess these effects and potentially be used to develop management practices and strategies to improve milk production on dairy operations. This is a well written manuscript and provides a depth of knowledge, however, this manuscript needs some work in terms of organization and flow throughout the paper. Below I have provided a few general suggestions and within the PDF file more specific edits for the authors. These suggestions are mostly editorial and clarification in order to strengthen the article.
General Comments: Possible keyword may be perturbations since that is what the manuscript is about or even “challenges”. No spaces between number and % symbol (2 % to 2%). For numbers such as 10000 please use commas 10,000 in manuscript and tables. Were all goats used for analysis fall kidding? Consistency for headings and subheadings (i.e. headings use capital for each major word and bold; subheadings bold and italicized). The authors mention that there is limited information. Could clarify that there is limited information in dairy goats and that the information from other species may not be adequate to compare and analyze. In the discussion explain the parameters for clarity. In the discussion, could the effects of perturbation 1 have carry over effects onto perturbation 2? Would that be something that the authors would further analyze or investigate?
Download the review