
NIELSEN Birte L
- Universities Federation for Animal Welfare (UFAW), Universities Federation for Animal Welfare (UFAW), Wheathampstead, United Kingdom
- Animal behaviour , Animal welfare, Precision livestock farming
- recommender
Recommendation: 1
Review: 1
Recommendation: 1
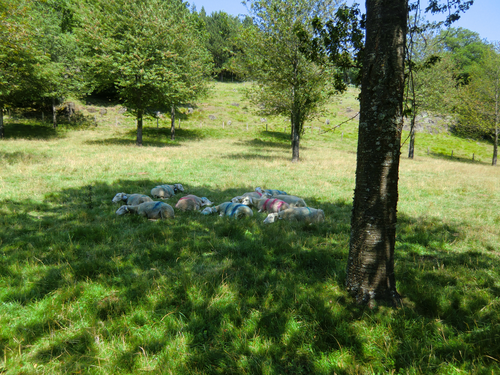
Shade use, welfare and performance of ewes grazing in temperate silvopastures differing in tree density
Provision of optimal shade for ewes: a question of choice
Recommended by Birte L Nielsen based on reviews by Matteo Chincarini and Pol LlonchAs the world slowly (or not so slowly) warms, the ability to regulate heat becomes even more pertinent for livestock kept in enclosed areas. Trees are not always present on land grazed by sheep, and when the pasture has some forestation, the coverage will provide varying degrees of shade. In this study by Ginane et al. (2025), ewes kept in enclosures with different levels of tree cover were observed at different times over a period of three years to investigate the extent to which the animals chose to spend time in the shade. By using fields with very different provision of shade (approximately 1, 40, and 81% shade, respectively), the authors wanted to test the hypothesis that ewes would actively seek out tree shade when the combined temperature and humidity increased – especially if the conditions reached levels associated with heat stress. Even at the lowest provision of shade, which consisted of a single tree in the paddock, all ewes could fit within the shade cast by the tree; but if the distribution of ewes or groups of ewes were random, i.e. independent of shade, the likelihood of these ewes being in the shade by chance was effectively 1%. By factoring in the element of chance, the authors found that mean shade use was greater than the tree canopy cover for the low and medium shade treatments, whereas it didn’t differ from chance for the densely forested treatment. Across treatments, all ewes spent just under 60% of the observation time grazing, and the ewes with the low and medium level of shade actively selected shade for foraging activity, whereas the ewes with over 80% canopy cover avoided it. Across treatments, shade was used primarily for resting and ruminating.
Tree cover affected the availability of forage in a negative manner, with more biomass available for ewes in the low shade treatment and significantly less in the high treatment, although this did not translate into significant differences in live weight or body condition score. Using this information, Ginane et al. (2025) calculated the optimal level of tree cover to be somewhere between the low and medium cover, at roughly 30 trees per hectare – preferably spread out over the area to offer different locations of shade and to encourage a natural spread of manure.
This longitudinal study of shade use by ewes provides novel and useful information on the positive and negative effects of tree cover in paddocks used to rear ewes with lambs. The authors raise the limitation of the study themselves, and they would have liked to also include observations on non-sunny days, to be able to eliminate place preferences independently of shade availability. But the clever calculation of active shade-selection makes this study easily applicable for use in the assessment of paddock suitability for pregnant ewes.
References
Cécile Ginane, Mickaël Bernard, Véronique Deiss, Donato Andueza, Camille Béral (2025) Shade use, welfare and performance of ewes grazing in temperate silvopastures differing in tree density. Zenodo, ver.4 peer-reviewed and recommended by PCI Animal Science https://doi.org/10.5281/zenodo.15001481
Review: 1
From data on gross activity to the characterization of animal behaviour: which metrics for which purposes?
A guide to improving the use of activity data in animal research
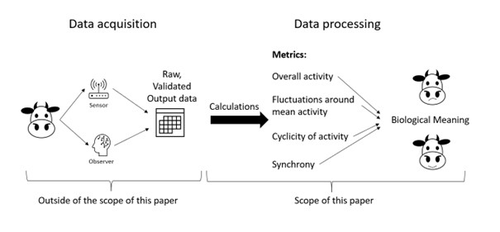
Recommended by Matteo Chincarini based on reviews by Birte L Nielsen and Anna OlssonIn production animals, behavioural activity plays a crucial role across a wide range of scientific disciplines and is often measured for various purposes depending on the field: ethology, animal welfare, reproduction, animal production, and so on. Historically, direct observation was the primary method of collecting such data, a process that was time-consuming and prone to possible observer bias. With the advent of automated systems and sensors, behavioural activity can now be recorded continuously and non-invasively, leading to a growing body of more reliable data (1). However, the lack of standardisation in how these data are calculated and interpreted has created challenges for cross-study comparisons. To fully harness the potential of studying behavioural activity, scientific studies must harmonise the methods used to calculate this measure. Standardising these methods would make it easier to compare results and identify possible gaps in knowledge.
In the work by van Dixhoorn et al.(2), the authors examine the various metrics most commonly used to study behavioural activity. Through a series of examples, they address the definitions, calculation methods, and biological significance of metrics such as overall activity, fluctuations around mean activity, cyclicity of activity, and synchrony between animals. The authors suggest how these different metrics can be applied in specific contexts and guide readers in using appropriate terminology to ensure future studies are more easily comparable. In addition, by clarifying these concepts, the authors provide researchers with the tools to make informed decisions about which metric best suits their study's objectives.
A key contribution of this work is its emphasis on standardising the metrics and terminology used in behavioural activity studies. Studies using different metrics may arrive at conclusions that appear contradictory, not because of actual differences in animal behaviour, but due to inconsistencies in how behaviour is quantified. By advocating for a common framework, the authors aim to improve the replicability of studies, facilitate meta-analyses, and allow for a more cohesive understanding of animal behaviour across different research groups. This, in turn, could accelerate the identification of key behavioural indicators, ultimately leading to better animal management practices and welfare assessments.
This article provides a timely and valuable contribution to the field of animal science. As technology continues to evolve, so too must our methods for interpreting the vast amounts of data it generates (3). By ensuring that studies are comparable and data is interpreted consistently, the research community can work towards more meaningful discoveries in animal behaviour. I highly recommend this paper to researchers looking to deepen their understanding of activity metrics in animal behaviour studies.
References
1. Rushen J, Chapinal N, de Passilé AM (2012). Automated monitoring of behavioural-based animal welfare indicators. Animal Welfare 21(3):339-50. https://doi.org/10.7120/09627286.21.3.339
2. van Dixhoorn IDE, Aubé L, van Zyl C, de Mol R, van der Werf J, Lardy R, Mialon MM, van Reenen CG, and Veissier I (2024). From data on gross activity to the characterization of animal behaviour: which metrics for which purposes?. Zenodo, 10420600, ver.5 peer-reviewed and recommended by PCI Animal Science. https://doi.org/10.5281/zenodo.10420600
3. Riaboff L, Shalloo L, Smeaton AF, Couvreur S, Madouasse A, Keane MT (2022). Predicting livestock behaviour using accelerometers: A systematic review of processing techniques for ruminant behaviour prediction from raw accelerometer data. Computers and Electronics in Agriculture 192:106610. https://doi.org/10.1016/j.compag.2021.106610